Outlook

Measuring Success.

Key metrics every downtown district should track.

Downtown districts generate more measurable value than most boards and city partners realize. The challenge is not finding the data. It is deciding which numbers actually tell the story of your work and building habits that keep those numbers current.

Why this matters
The right metrics turn field effort into a story that leadership can act on
Without a consistent measurement framework, district teams spend more time defending their work than improving it. The metrics in this piece give you a foundation to do both.
Overview The metrics Key takeaways FAQ Contact

Tracking the right data is how you stay honest with yourself and your stakeholders.

You are shaping how people experience a place, supporting small businesses through difficult seasons, coordinating field teams across multiple priorities, and making the case for public investment in a community that sometimes takes the work for granted.

With so much happening at once, it is easy to lose track of what is working and where things need attention. That is where a consistent measurement practice earns its keep. Not to generate more reports, but to give you a clear picture of how your efforts are adding up over time and to make sure that picture is legible to the people who matter most.

The metrics covered here were selected because they map directly to the conversations district leaders have most often: with boards, with city partners, with funders, and with their own teams. Each one is trackable, communicable, and connected to real operational decisions.

Five categories that tell the full story of district performance.

No two districts track their work the same way, and there is no single right answer. What follows are the five categories most district teams find themselves returning to when they need to communicate value, justify budget, or understand where to focus next.

Pillar 01

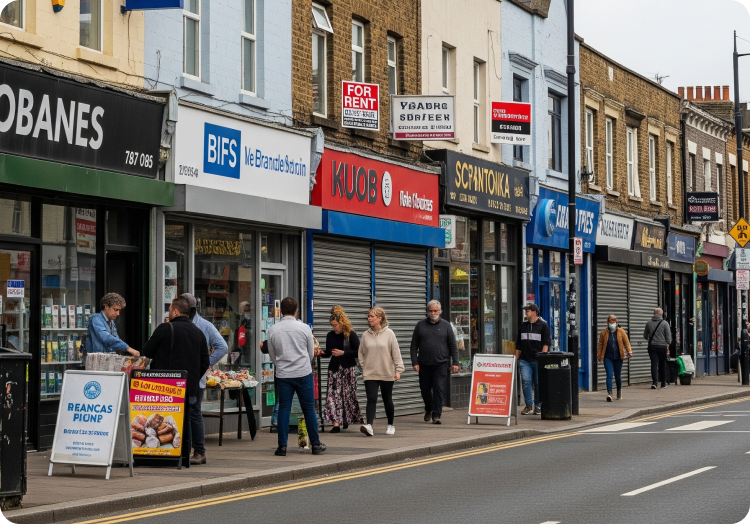
Business openings and closures

A lot of districts watch what is opening and what is closing, and for good reason. Consecutive closings warrant a closer look at the contributing factors in the business environment. Consistent openings signal that the energy of the district is active and welcoming.

  • Track changes in real time rather than relying on word of mouth or quarterly walk-throughs.
  • Check in with businesses each year to document how many jobs they support, adding economic depth to your reporting.
  • Use this data to respond proactively when patterns shift, rather than reacting after the fact.
Pillar 02

Assessment values

Assessment values show how your district is faring over time, and they carry real weight in budget planning and stakeholder conversations. A trending property value, visualized clearly, is far more persuasive than a feeling or a rough sense of the number.

  • Select a cross-section of properties to track year over year as a consistent index.
  • Keep a trend line on your dashboard so the data is accessible when you need it for a board presentation.
  • Use this evidence to make your needs case to city partners with confidence and clarity.
Pillar 03

Property and business contacts

It is striking how much time district teams spend hunting down a single contact. Important information lives in someone’s personal email, a mobile phone, or a shared file whose version nobody can confirm. When districts commit to a centralized platform with consistent data hygiene, individuals save a remarkable amount of time finding what they need.

  • Keep contact records for business owners, property managers, and key stakeholders in one shared system, not scattered across personal devices.
  • If your team uses Outlook or Gmail, a plugin lets you log new contacts directly from your inbox and associate them with businesses and properties without leaving your email.
  • Treat data hygiene as an ongoing team habit, not a one-time cleanup project.
Pillar 04

Events and community involvement

Placemaking events shape the character of your district, and they take significant planning. Tracking attendance, surveying participants, and recording how members of your community engage gives you the information needed to move from ad hoc programming to strategy driven by what actually works.

  • Survey event-goers on-site using QR codes that are deactivated when the event ends to prevent responses from being submitted after the fact.
  • Collect both qualitative and quantitative feedback so you can convey impact in full, not just headcounts.
  • Use the data to identify which events build community most effectively and concentrate resources there.
Pillar 05

Field work and street-level impact

Much of the work that makes a downtown feel safe and welcoming happens quietly, day after day. Cleanups, outreach, and addressing minor issues before they escalate. That effort deserves to be communicated clearly to the stakeholders who fund it, not just experienced by the teams who carry it out.

  • Log the number of cases or service requests handled over a defined period, and how quickly each was resolved.
  • Record the volume of graffiti, unauthorized signage, and waste removed.
  • Track connections made with unhoused individuals and service referrals completed.
  • Use Ambassador Route Tracking to confirm that every block in the district is being serviced and to identify areas that may be overlooked.
Tracking business openings and closures in a downtown district
Your district data, organized and ready when you need it.

District360 is built around the way downtown teams actually work. From contacts and properties to field cases and event records, everything lives in one place, and every team member can find what they need without asking twice.

See how it works for your district
Property and business contact management in a downtown district platform
Every district tracks a bit differently, and that is by design.

There is no single right way to measure the value of your impact. Some districts focus on economic growth. Others concentrate on placemaking and events. Others prioritize the safety and cleanliness of the public realm. The most important thing is to identify the metrics that align with your strategic vision, track them in a way that is both simple and useful, and communicate them in language that your board and city partners can act on.

A metrics-focused mindset does not have to mean a data-heavy operation. It means being intentional about which numbers you watch, making sure those numbers are trustworthy, and returning to them often enough that they shape decisions rather than just appearing in an end-of-year report. That habit builds accountability, tracks progress over time, and strengthens your case for funding and continued support.

Event tracking and community involvement data for downtown districts

The goal is not more reporting. It is better visibility into the work you are already doing.

A platform built for downtown districts does not replace your judgment. It keeps your data organized, surfaces trends, and makes it easier to communicate the value of your work to every audience that needs to hear it.

  • Which metrics does your board currently rely on, and are they telling the full story?
  • Where is contact information living today, and how long does it take to find what you need?
  • How are you currently communicating field work to stakeholders who never see it in person?

Curious how other districts are tracking their work?

At District360, we have worked in the industry and spent time listening to district leaders, field teams, and city partners. If you want to see how a platform built specifically for downtown districts can support the way your team works, reach out and we will walk you through it.

Questions district teams ask about measurement.

Where should we start if we are not currently tracking much at all?+
Start with the metric that comes up most often in conversations with your board or city partners. If they ask about business health, begin there. If they ask about field responsiveness, start with case tracking. Picking one category and tracking it consistently for a quarter will teach you more about what your district needs than trying to instrument everything at once.
How do we handle contact data that is scattered across emails and personal phones?+
The most effective approach is to create a single place where new contacts are added by default, and then build a lightweight habit around it. If your team uses Outlook or Gmail, a plugin that lets you log contacts directly from your inbox removes most of the friction. The goal is not a perfect database on day one, but a system that improves consistently as your team uses it.
How do we make field work data meaningful to a board that never sees the street?+
Translate numbers into context. A board that hears “we removed 400 bags of trash last quarter” understands the volume of work. A board that also sees route tracking data confirming that every block in the district was serviced understands the consistency. Both numbers together tell a story that neither can tell alone.
Is it worth surveying event attendees if turnout is small?+
Yes, because the value of event feedback is not statistical significance. It is qualitative signal. A small event with strong qualitative feedback about why people came, what they valued, and whether they would return gives you far more useful programming guidance than a large event with no feedback at all. Even ten completed surveys tell you something worth knowing.
Does District360 work for smaller districts without a dedicated data person?+
It was designed with exactly that constraint in mind. The platform is built specifically for downtown districts, which means it fits the way district teams actually work rather than requiring you to adapt your operations to a generic tool. You do not need a data analyst to get value from it. You need a few consistent habits and a platform that does not get in the way.

Continue reading.

Working through this in your own district?

We are happy to share what is working for others.

Talk To An Expert